DUTCHING PART III – STAKING AND BANKROLL MANAGEMENT
Over the last two weeks, we've looked at how the percentages work with dutching and a quick and simple method as to how to find some qualifiers.
Here are the two articles, in case you missed them and you'll definitely need to read them for this article to make sense –
As with any betting system/staking plan, we will come across losing runs. The beauty of dutching is that losing runs can be kept to a minimum BUT they will, and do often happen.
This is where we need to be clever with our preparations, set things up properly before we start to bet and take note of how losing runs can affect us in many ways.
Let's look at an example –
We've been running a system that has, so far shown 250 qualifying selections.
From those 250 selections, we're showing a 77% strike rate. That's nearly 8 from 10 bets showing a positive return.
With this information, and having paper traded the selections, we're now ready to bet.
But how do we stake them and how much of our bankroll do we risk?
Personally, I now enter all of the data into an Excel calculator that I've designed. As per the image, below, you'll see how I come up with my figures –
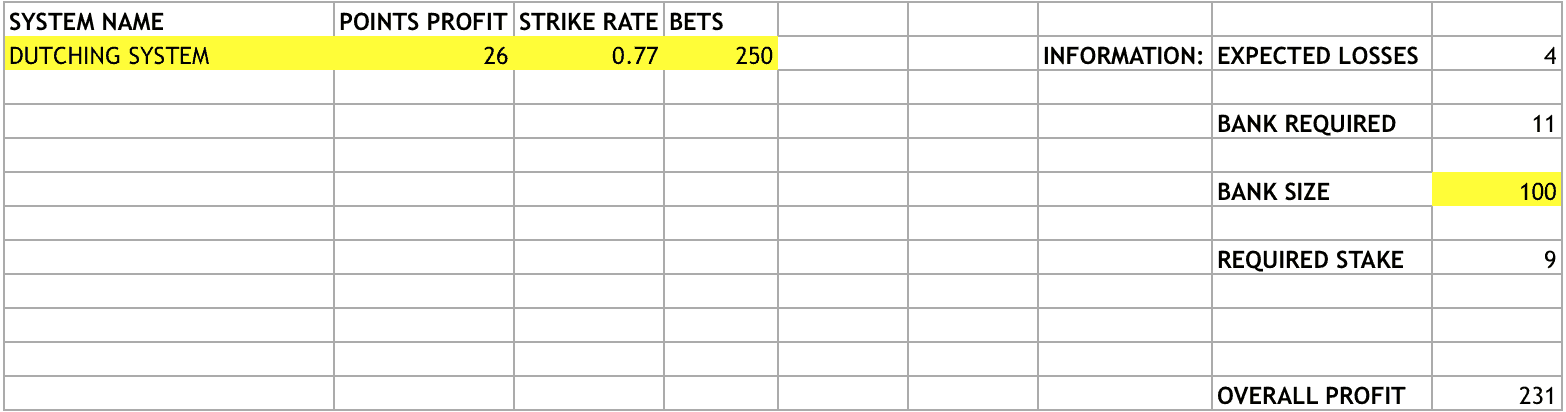
The Dutching System (as an example) has made 26 points profit over 250 bets. The strike rate is 77%. All of this information has been entered into the yellow boxes, including the Bank Size.
The Excel sheet (available upon request, by leaving a comment, below 😉 ) has shown me that I need to be staking £9 per bet and this will safeguard my bank.
We would expect to see 4 losing bets in a row, with the current data, which would require a bank of 11 units. Should we encounter the 4 losing bets upon starting to bet with real money, we would still have 63.63% of our bank left to continue betting and inevitably hit that winning streak.
So, we now have the amount that we're prepared to lose based on our paper trading results.
But, how do we work out how to dutch the right stakes per selection, based on our bank and NOT what profit we're looking for in each event?
Here come's the maths and it's time to make a brew, sit down and concentrate!
Our Dutching System has shown us two horses in a qualifying race. This is the same race as shown in last week's article
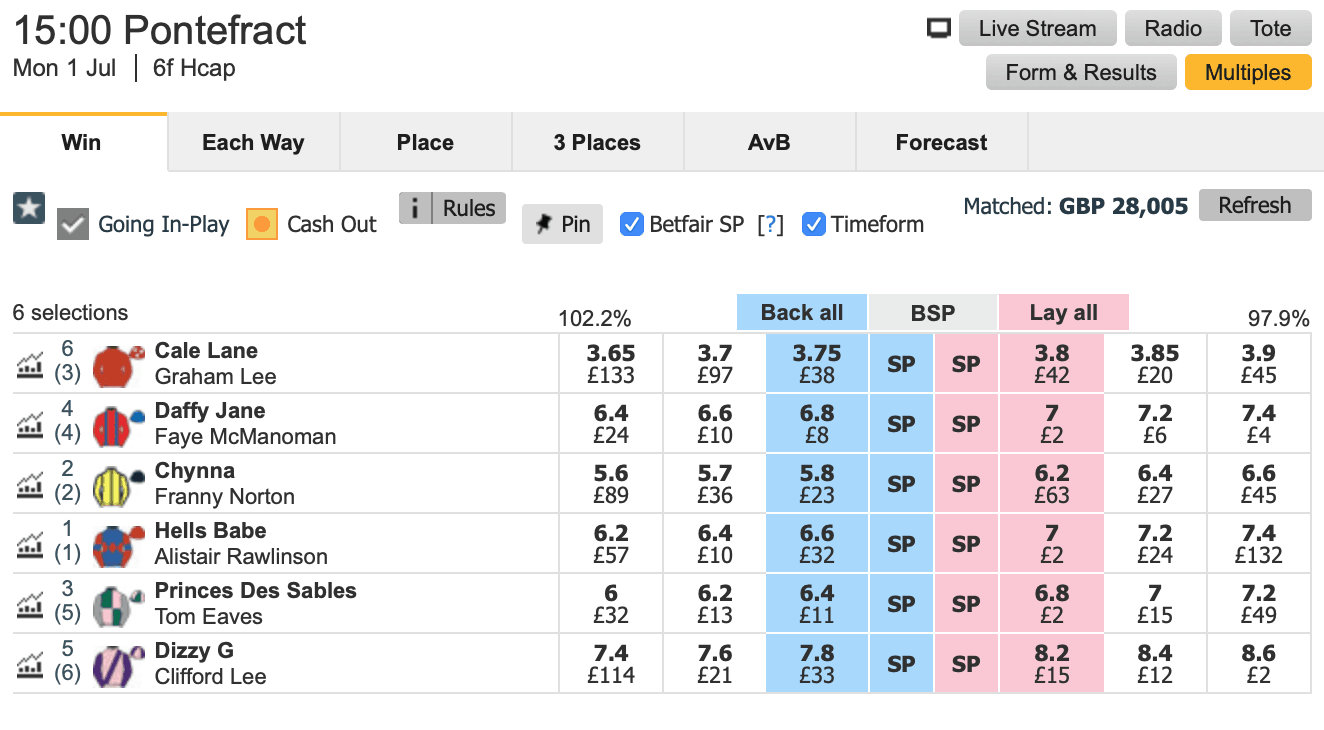
Our selections were Cale Lane and Daffy Jane, trading at 3.75 and 6.8 respectively.
Using our first article in this series and working on the percentages, we get the following –
Cale Lane = 3.75. So 100% divided by 3.75 = 26.67% chance of winning
Daffy Lane = 6.8. So 100% divided by 6.8 = 14.71% chance of winning
Add the two together and we get – 26.67% + 14.71% = 41.38%.
We now divide the 41.38% into 100 to get = 2.42 in decimal odds.
This equates into just over 11/8 in terms of fractional odds.
So, we take the percentages and this decides what stakes we will be using.
We take our stake = £9 from our calculations above and divide this by the percentage chance of our two selections.
Therefore 9 divided by 41.38 = 0.21749
The figure 0.21749 is now multiplied by the percentage chance of each selection (I know it's a massive ball ache!! but once you've mastered this calculation, you'll be well on your way to making profits!)
So, 0.21749 multiplied by 26.67 (Cale Lane's percentage chance of winning) = £5.80
0.21749 multiplied by 14.71 (Daffy Lane's percentage chance of winning) = £3.20
There you have it. A total stake of £9 and this is within our safe staking, based on our earlier calculations.
Here's what happened in that race –
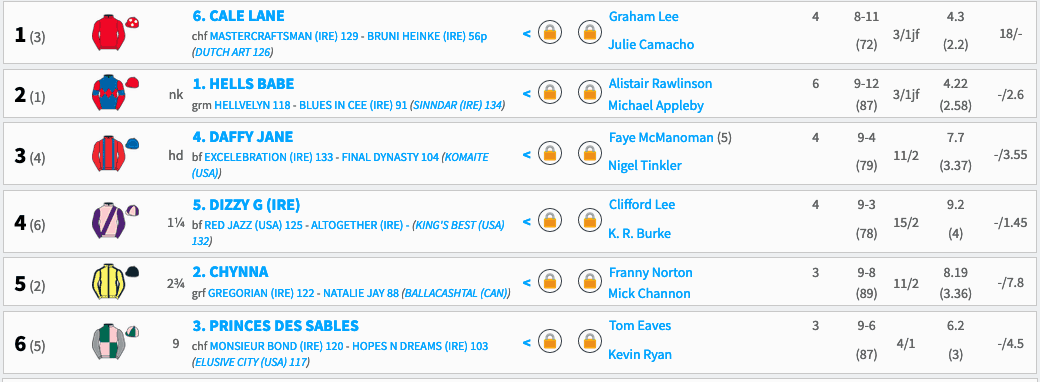
Cale Lane winning and a stake of £5.80 @ 3.75 resulted in a return of £21.75 minus our £9 stake and after commission, resulted in a profit of £12.11 to add to our system's results.
I hope that all makes sense and the calculations are easily enough digested? Let me know in the comments, below if you have any questions or need a copy of the Excel sheet.
I'll be next week, with a look at how the above can be simplified with another calculator that I've built and how we can add all of this to a portfolio that will really ramp up your profits!