Betting Strategy – Understanding Drawdowns
How Drawdowns Affect Your Betting
How familiar you are with the term max drawdown, will largely depend on your levels of exposure to the financial markets and related stock investment systems. The world of stocks and shares may be where the concept originated, but like much from the world of trading, max drawdown can also be utilised as a significant tool in our betting armoury. First things first though…..
What is Max Drawdown?
In simple terms max drawdown can be thought of as a measurement used to define the risk and volatility associated with an investment or betting strategy. The higher the max drawdown figure the greater the potential volatility and vice versa.
In betting terms, it is essentially a measure of the maximum downswing we can expect to experience when following a betting strategy over time.
Much as we wish they weren’t, losing runs are an inevitable aspect of following a betting system. However, not all losing runs are created equally. It is certainly useful to know in advance what kind of losing runs can be expected from a particular betting system. How bumpy a ride are we in for? This is where max drawdown comes in, but how do we ascertain it’s value?
How Do We Calculate It?
Provided we have historical data relating to a betting system, max drawdown is in fact relatively easy to measure.
It is defined as the biggest difference between a highpoint in a series of results and a subsequent low point.
Let’s look at a couple of profit and loss graphs to illustrate the concept.
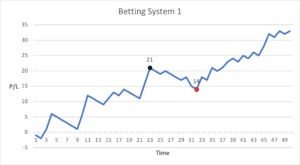
Betting System 1 represents a relatively stable betting system. Our Max Drawdown here occurs between the peak at a profit of 21 and the subsequent dip to 14. This system therefore has a max drawdown of 7 units.
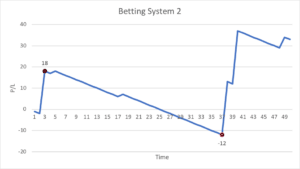
In Betting System 2, the end result may be the same (33 units profit over the period) but the path to that result is very different. A simple glance at the graph is enough to suggest that this represents a markedly more volatile system. A suggestion which is borne out by the max drawdown calculation.
Here our biggest dip occurs between the peak at a profit of 18 units and the subsequent dip to a total loss of 12 units, representing a max drawdown value of 30 units.
A note on calculating max drawdown in excel
The results of a betting system are not always displayed graphically, or perhaps the graphs are over such a long period of time that it can be difficult to determine the data points to be used for the max drawdown calculation.
An excel spreadsheet is your friend here. All you need now is access to a table of the results of the system under consideration. All such tables should contain a running bank or total profit column.
Simply copy and paste this column into column A in your excel spreadsheet and then apply these steps.
- In cell B2 enter the following: =max(A2,B1)
- In cell C2 enter the following: =if(A2=B2,0,MAX(C1,B2-A2))
- In cell D2 enter the following: =if(and(C1>0,C2=0),C1,””)
Next, drag all formulae down to the last row of the betting systems total profit data.
Finally in any empty cell enter =MAX(d:d)
Click enter and the number revealed is the max drawdown value for the system under consideration.
Max Drawdown’s importance to betting strategy.
The success of many a betting strategy depends on the ability to maintain consistent staking over time. Over-staking can result in either feeling the need to reduce stakes following a losing run – and consequently benefitting less from any future upswing -,or even worse, going broke before a long term profitable system has had the chance to bear fruit.
This brings us to our first advantage of an understanding of max drawdown: It allows us to stake correctly.
Using the two betting systems illustrated above, we should be happier to use a larger level stake in relation to our bankroll when following system 1 with its max drawdown of just 7 than system 2 where losing runs of 30 units are a very real possibility.
A stake level which for system 1 would result in a sure and steady long-term profit, may well see us go broke if used in system 2, which if followed at all, would likely require a cautious staking plan.
By understanding the likely volatility of a system in advance, we are able to plan and implement an appropriate staking strategy, striking the desired balance between maximising profit and minimising the prospect of bankruptcy.
Another major advantage of a defined max drawdown value, is that it can act as a warning.
Say for example that we are following a betting system with an expected max drawdown of 40 units, calculated using years’ worth of data. However, much to our disappointment, we have now endured a downswing of 50 units. How can this be?
It is entirely possibly that this may simply be a quirk in the results sequence, and things will return to normal. After all, what happened in the past is unlikely to represent an exact mirror image of the future.
However, we can’t discount the possibility that what was once a winning system, is a winning system no more. Perhaps there are new factors at play affecting the viability of the methodology behind our selection process, or perhaps the profitable aspects of our system have now been efficiently priced into the market. In such an instance it well may be time to re-evaluate our betting system.
But how to tell the difference? Should we continue to weather the storm? Or draw stumps and start afresh.
It’s difficult to put an exact figure on when we should heed the warning a max drawdown value being exceeded, but a good rule of thumb is that should the value reach 1.5 times the expected amount, it is wise to cease trading until we are happy that all is well with the system. E.g. for our max drawdown system we would pause to consider after a downswing of 60 units. 1.5 x 40 = 60
Using Max Draw Down To Select An Appropriate Betting Bank
The exact sum in a betting bank will clearly vary from individual to individual, as will preference as to the boldness of the staking strategy to be followed. However, whatever the exact sums or the approach used, the amount contained in a betting bank should always be enough to withstand the expected max drawdown.
Say our preferred unit stake is $100, and we are utilising a system with a max drawdown value of 15. Our betting bank should be at least $1500.
Applying the above theory in reverse, max drawdown can also be used to determine the maximum unit stake for a set betting bank. For a betting bank of $2000 and system with a max drawdown of 25, the maximum unit stake we should use would be $80. (2000/25=80)
It is however advisable to stake below these maximum levels to avoid exerting unnecessary pressure on your bankroll. We would advise always having a bankroll of double the amount suggested by the max drawdown in order to maximise the possibility of sticking comfortably with a system in the long run.
Mental implications of Max Draw Down
The benefits of an understanding of max drawdown do not begin and end with the selection of an appropriate betting bank and staking strategy. A clear understanding of the likely volatility of a system can also have a hugely positive impact on our mental approach to betting.
Losing runs can often be stressful and lead us to; question what we are doing, possibly tweaking a winning system to detrimental effect, or even the always disastrous chasing of losses.
Put simply it’s far easier to stay on an even keel when we are winning than when in the midst of a downswing. In any form of financial investment system, maintaining clarity of mind and focus on the long run is essential to success.
So how exactly does drawdown help in this regard?
Say for example that analysis of our betting system tells us that our max drawdown value is 20. Does that not make a downswing of say 11 units a little easier to withstand?
Really it should. Such a run is nothing to be concerned about, it is simply an inevitable downturn – well within the expected range – on the sometimes rocky road to long term profit.
To put yourself on a more even playing field with the odds compilers.
Think the odds compilers pluck there prices out of thin air? Or create them purely based upon their own expertise? Think again. Be sure that a detailed analysis takes place and a complex computer algorithm generates prices.
Whilst human opinion may factor into odds compilation, this opinion will always pay second-fiddle to trusty algorithm.
Betting on a whim is very much the way of your average punter and such whims and feelings are the predominant reason behind the bookmakers consistently being able to turn such a profit.
By creating and experimenting with your own patterns and systems on a powerful platform, you will be able to analyse hundreds of thousands of matches and draw conclusions of your own. You don’t need to be a computer whizz either.
In doing this you will align yourself more with the approach utilised by the professionals. Put most simply, an approach based on head (i.e numbers and data), than heart (whims and feelings).
To create a method of analysing and tracking your theories.
You may have a number of plausible ideas around factors which will help determine the result of a football match. E.g. Is a team on a winning or losing run? Have they faced a number of fixtures in a short period of time? Are the consistently scoring/conceding lots of goals?
Whilst these thoughts and questions are still confined to your head, they remain only ideas, and of limited use from a betting perspective.
A betting model – amongst other things – allows you to translate these ideas into hard trackable data, and from there to investigate whether it is possible to build a profitable betting strategy on the basis of these thoughts and formulations.
To build a pricing model based upon your assumptions
This is really one of the most crucial aspect of the betting model. A betting model enables you to not only assess the relevant factors pertaining to the outcome of a sporting event, but to then translate this assessment into a list of betting odds for each possible outcome of said event.
Armed with this information, you are now ready to go to war with the compilers, choosing to do battle only where your betting model prices differ from those on offer with the bookmakers.
It’s funny, because you’ll hear a lot of punters talking about “value” but to truly identify value you need to have a genuine idea of what the price should be.
In summary, a betting model enables you to test out your thoughts and theories based on real historical data. Once you have a model created, you can test it out and see if the returns accurately reflect your theories and analysis. Rewarding emotionally, rewarding financially!
And So To The How..Building Your First Betting Model
Hopefully the above has now convinced you – at least to some degree – that creating a betting model may be a worthwhile endeavour. So how exactly do you go about doing it?
There are a whole host of winning methods to be hit upon using Predictology, but you need to ensure you fully understand the fundamentals of the platform so you can test them. We’ll talk you through them now.
Data: Your building blocks to success.
A theory is all well and good, but without relevant data to test your theory, it would be of limited use.
In football betting, your average punter will often look at the form book and at previous head-to-heads but not go much further than that.
The Predictology platform holds information from over 200,000 football matches. Use filters such as date range to look back over this season, or the last six. It’s up to you.
Need to know how many times X team has scored more than 3.5 goals away from home following a home loss. No problem. You can do it.
Data manipulation: Putting your building blocks to good use.
So, data is the raw material with which we are to work, but how best to mould it into something to meet our – profit accumulating – goals?
This is where the use of data analysis software comes in. Whether your chosen tool be a software package such as Matlab, an Excel spreadsheet, or the Predictology site (which does the hard work for you), it is imperative that you have a way in which you are able to record and analyse your collected data.
Data entry is often the most laborious of these tasks and that is another benefit of using a stocked up platform such as Predictology bonuses – it’s ready and waiting for action.
It will undoubtedly pay to learn as much as you can about the software you are using, that’s how you’ll become a master. The more you put in, the more you’ll get out.
But rather than the new FIFA release, the thing you’ll be getting out isn’t kudos or bragging rights (although you will get both of those things) it’s money.
The Process In Action
Let’s look at a team’s shot statistics for a very basic example of a betting model clicking into gear.
A common-sense theory would tell us that the more shots a team has in a football match, the more likely they are to score and therefore win the game. By recording both the total shots stats for each team in a League, and also each team’s win percentage, we would be in a position to plot these two variables against each other to see if our theory proved correct.
From here – using the graph function in excel for example – it would be possible to ascertain a line of best fit for the relationship between total shots and win percentages.
With win percentages and odds being so closely interlinked – should we believe we are able to accurately predict a team’s likely number of shots for a given match up – we would then be able to calculate what their corresponding win percentage and resultant betting odds should be.
As mentioned this is a somewhat crude example, but it does serve to illustrate how many betting models begin. The addition of more factors, such as number of corners or recent form figures for example, and the use of a more advanced data analysis technique, would no doubt add to the effectiveness of the model. That is the beauty of the betting model though; it enables you to investigate the factors which YOU deem to be important when it comes to the outcome of a sporting event.
Testing Your Model: Does It Work?
Having developed your betting model, the immediate instinct may be to spring straight into battle against the bookmakers. A more prudent approach however, is to test how the model works first.
Depending on the type of model, this can either be done by a process of data-mining past results to see how well they fit the model – Predictology will do the mining for you if you tell it where to dig- or by using the model as a prediction tool and recording the actual results against those you predicted.
In either case, the testing of the model may highlight blemishes and/or enable you to tweak the model by introducing or removing variables, or weighting the existing variables differently.
All of which should hopefully improve the effectiveness and profitability of your model.
Betting Models: A Little Help
For those with the time and inclination, building your own betting model does offer the benefit of the greatest degree of personalisation
One of the main benefits of Predictology is that it won’t take the amount of time that such data manipulation often would if armed with a form book and a blank excel spreadsheet.
The main bit of donkey work is removed by the data collection piece that we spent hours over. The data is there and available for you to use as your please.
Better still, we’ve built the platform in such a way that users can quickly and easily investigate systems based on customisable filters. Anyone who has taken a spreadsheet and tried to draw out information based on things like pivot tables will know how tricky it can all get when lots of information is involved.
Finally, you may be pleased to hear that a 10-week training series is available on Predictology which you can utilise as soon as you’ve signed up. We’ll be there to help give you the base skills before you go it alone and start taking money back from the bookies, for those not used to it – it makes a refreshing change!

Jon is the Founder and Chief Tipster at Football Advisor and Predictoloy. He started life as data analyst in the digital marketing field before find his true calling in the world of Football and Horse Racing Betting.
Jon has been sharing his professional expertise since 2009 and specialises in using objective data analysis and subjective experience of betting built up over more than a decade of professional betting.
In 2014, Jon also launched (and continues to run) the trusted Football Advisor service service which provides a variety of football and horse racing betting models and portfolios. A few years later, Jon launched the Predictology platform which is the worlds first betting system builder and analyser covering a wealth of football betting related statistics covering more than 200,000 matches.
Jon has also lent his knowledge and expertise to several of the trusted Premium Services offered by the respected Secret Betting Club, including Football Lay Profits. Racing Bet Profits and, most recently, Racing Lay Profits.