Reading Betfair Graphs Like A Pro Trader
How to Master Betfair Graphs like a Boss
Betfair Exchange novices are likely unaware of the existence of graphs. For others, they are a waste of time. However, it is essential to learn how to read them if you wish to become a successful trader in the long term. This article aims to help you do just that!
What Does a Betfair Graph Tell Me?
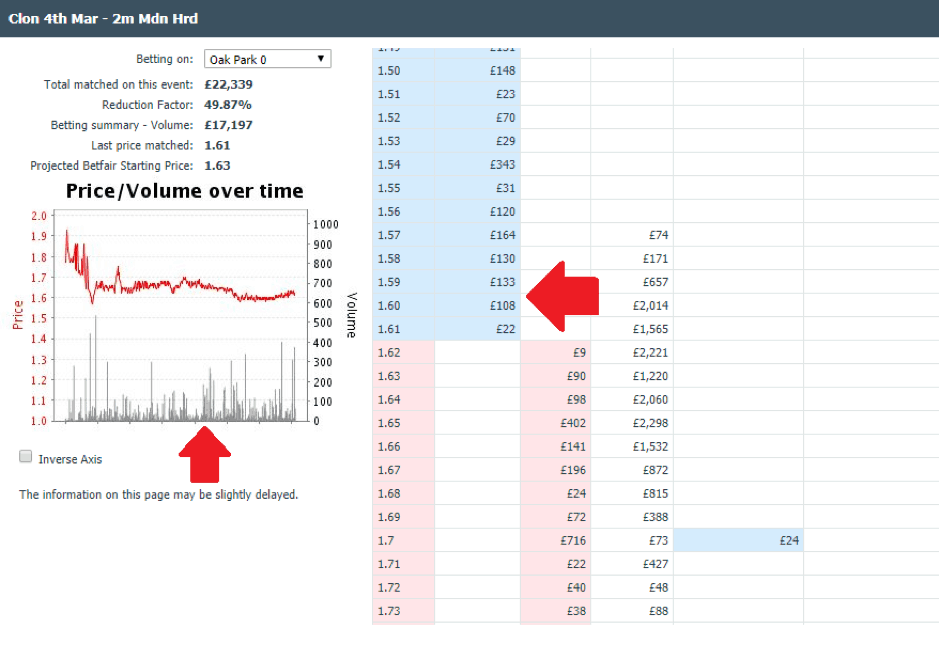
First of all, finding the graph is easy. Go into your chosen market, and click the little icon on the left of the market name. It resembles a chart. You will see something like this:
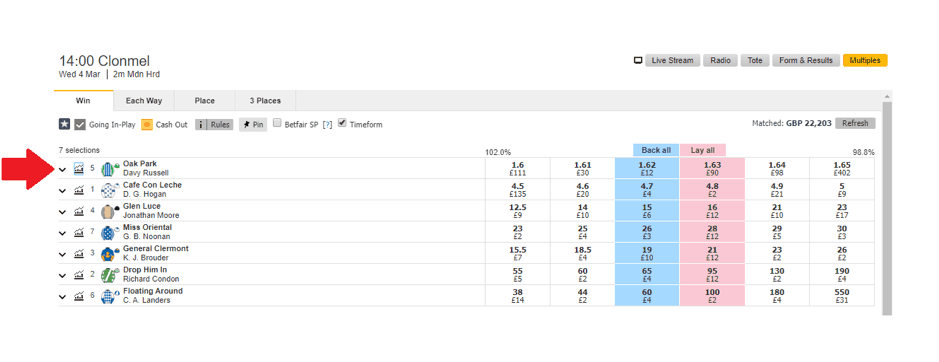
The above is the betting graph of a horse named Oak Park who was running at Clonmel. I took this screenshot over three hours before the race. Even so, there is £22,339 wagered on the event already. Oak Park is the clear favourite at 1.62.
I recommend that novice traders should always take a look at this graph when entering a new market. What it does is inform you of what has happened so far. It is a valuable piece of information when you know how to use it. The ‘Betting Summary – Volume’ figure is the amount wagered on the specific market you are looking at. In this case, we see that £17,197 was matched on Oak Park.
The ‘Last Price Matched’ figure explains the last price that Oak Park was matched. In this case, it was 1.61.
How To Analyse Betfair Charts
Let’s analyse the chart itself. The red line signifies the odds. We can see that Oak Park was slightly above 1.90 at one stage, before being backed down to its current price. The grey bars sticking out from the bottom explain the volume of cash wagered on the event. Punters wagered £500 on Oak Park when it was just below 1.60.
One issue with this graph is the lack of a timestamp. I can tell you that the market begins on the left-hand side of the graph and moves right over time. What you can’t determine is at what time the prices were matched. You don’t know when Oak Park was at 1.90, nor do you know when the volume of money caused the price to fall.
One thing novices must remember is that they can almost ignore the very beginning of the market. You should start to focus when the initial squiggly line gives way to a more consistent one.
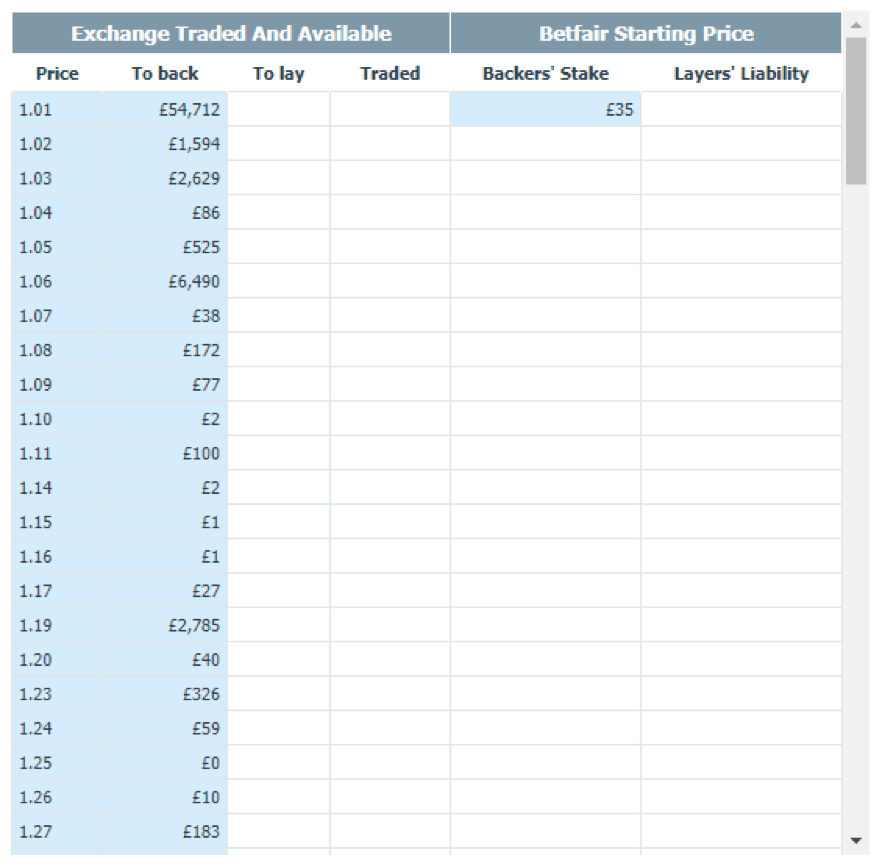
On the right-hand side of the screen, you can see the amount of money waiting to get matched at specific odds. You also see what has been backed and what has been laid. There is over £54,000 waiting to get backed at odds of 1.01. This is presumably by traders hoping for a quick and easy profit once Oak Park’s odds fall that low. In general, if a horse is 1.01 in play, it is going to win!
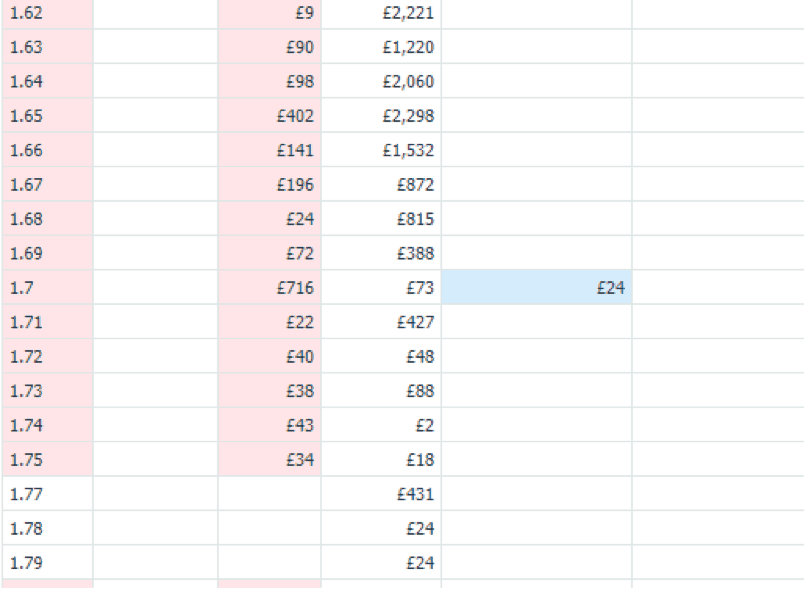
From the figures above, you can see that people wagered £2,221 on Oak Park when its price was at 1.62. I can tell you that some punters backed the horse as low as 1.57. Earlier in the morning, a handful of people managed to get a small amount of money matched at odds of 1.90.
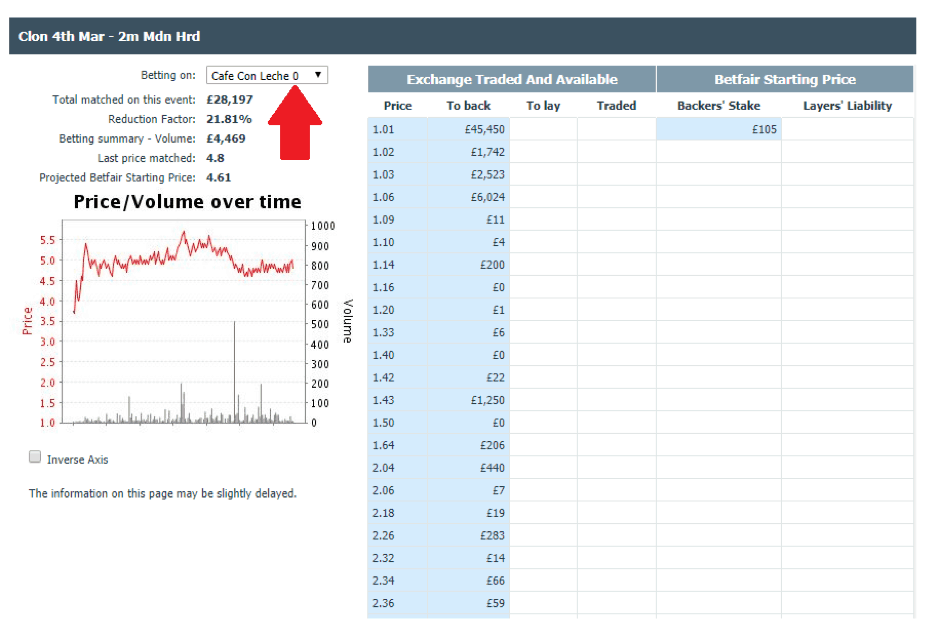
You can easily change the horse you wish to analyse by click on the ‘Betting On’ tab. I switched to Café Con Leche. This horse’s odds have drifted from around 3.80 to over 5.50 before falling again, to below 5.00.
Using the Betfair Graph to Your Advantage
The first thing to remember is that the graph is only ONE tool in your trading armoury. The lack of a timestamp means you don’t know when particular rises and falls in price occur. Also, it is an indication of what happened in the past. It does NOT mean the price and volume of money wagered will remain the same in the future.
In-play markets will fluctuate rapidly, depending on what happens. A goal in a football match renders previous trends irrelevant. Therefore, it is best to check out graphs before the event begins. If you insist on trading markets such as over/under goals, remember that a goal can occur at any time and ruin your plans.
You may find that specific patterns recur once you have enough experience. It is especially the case in the last 10 minutes before a horse race. Vast sums of money are wagered at this point, and a horse’s price can rise or fall rapidly within a few minutes. Experienced traders can identify patterns and scalp for quick and easy profit.
When trading horse racing, don’t forget the other runners! No matter what your graph says about one horse, if there is significant money for several other runners in the race, your horse’s price will likely drift.
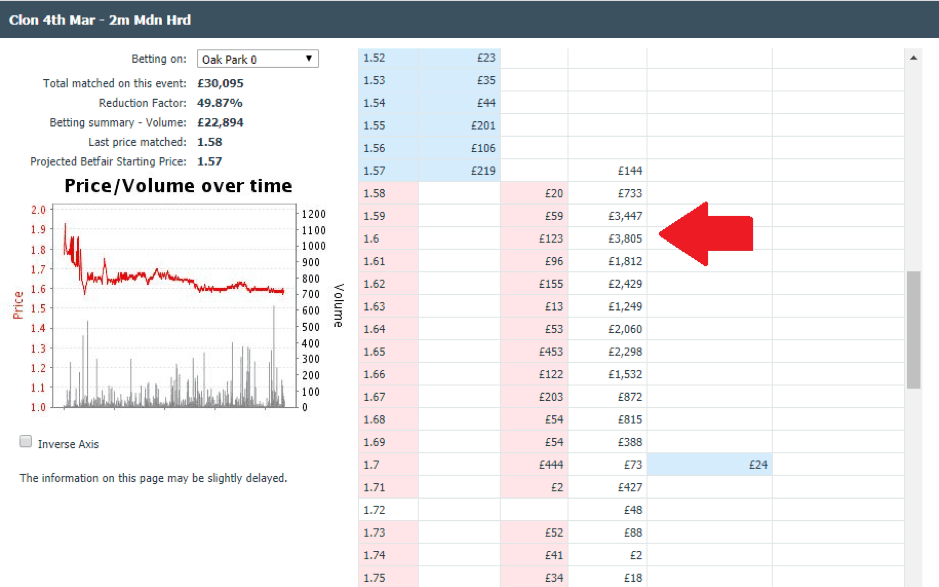
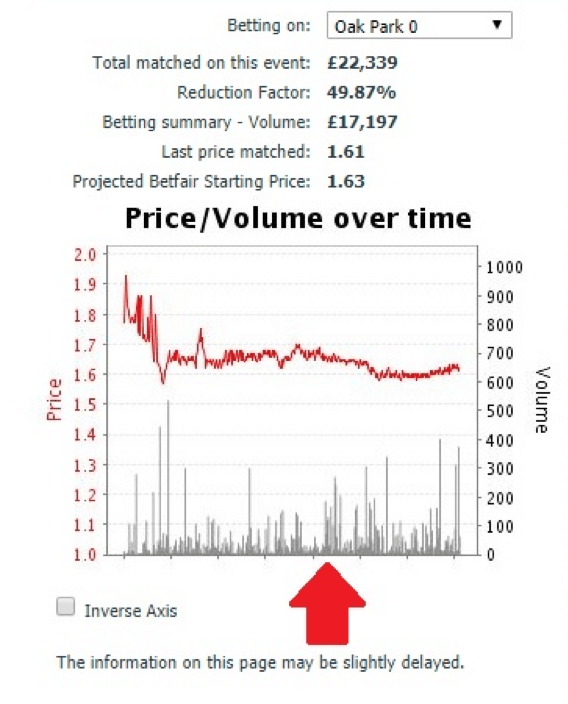
You can use graphs to search for clues or to decide to steer clear of a specific market. Forty minutes after the last screenshot relating to Oak Park, I took another one. As you can see, the total market is now over £30,000, and money continues to flood in for the favourite. Its price is currently 1.57, and more than £72,000 was matched at 1.59 and 1.60.
Will punters continue to pile in on Oak Park? You should consider checking such markets in the last 10 minutes. For example, if the favourite drifts slightly to say 1.70, you may decide to back in the anticipation that his odds will once again fall to the 1.59-1.60 where a reasonable sum of money was matched.
Final Thoughts on Betfair Graphs
Rather than ignoring the Betfair graphs or viewing them with trepidation, start learning how to read them. While they are no indicator of future odds availability, you can utilise them to make scalping choices, especially in horse racing. Incidentally, don’t make a trading decision based on one significant spike in the graph.
It is better to wait for a more consistent group of lines before making your move. If you see a cohesive grouping of smaller bets that cause the price to drift, for example, you can be more confident about placing a lay bet in the hope the odds continue to rise.
You can also use Betfair graphs to see if there are any support or resistance points. For example, if Oak Park’s odds keep fluctuating between 1.62 and 1.72. You can use this as an opportunity to scalp. When the price goes to 1.72, you place back bets. When the price goes to 1.62, you play lay bets, and so on.
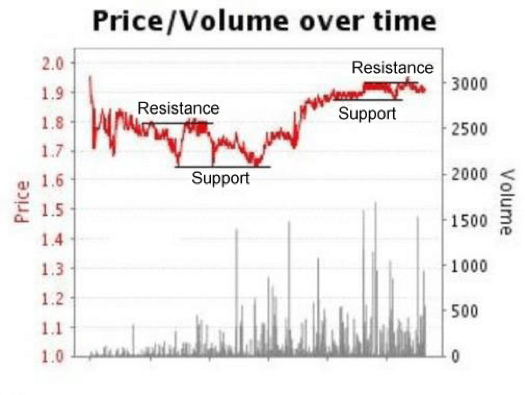
In the below chart we can show you a clear example of a good examples of support and resistance.
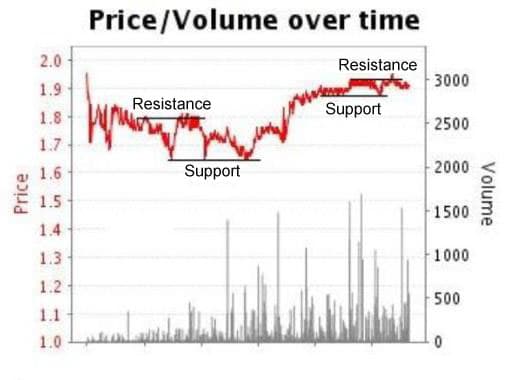
For a long while the selection in question was moving between 1.65 and 1.80. Later in the day, it broke the resistance line before settling again 1.88 and 1.95.
Another way you can use support and resistance lines is through scalping on football matches.
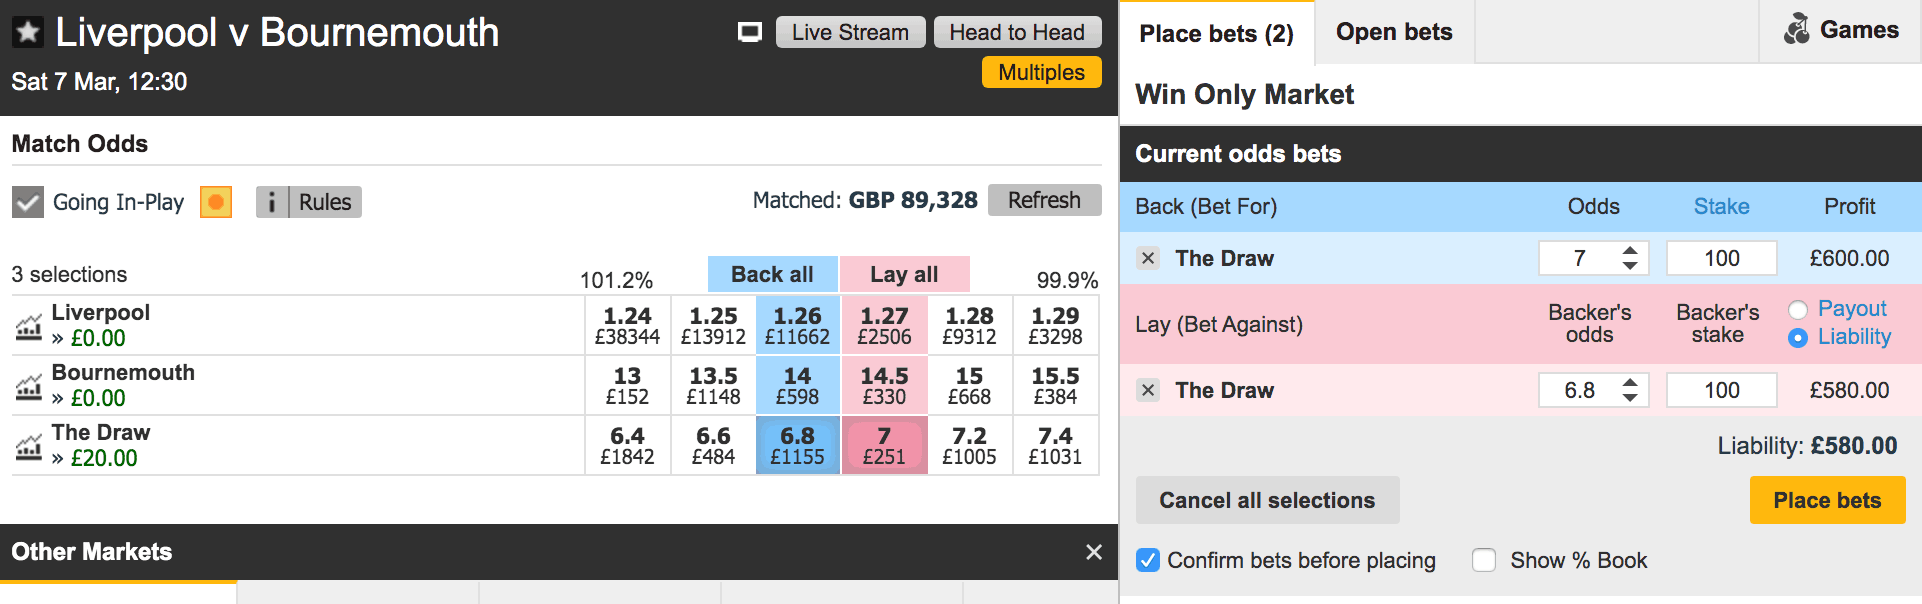
The below example is from today's early kick between Liverpool and Bournemouth. As we can see from the Betfair Chart, there is a lot of money being traded with the price barely moving.
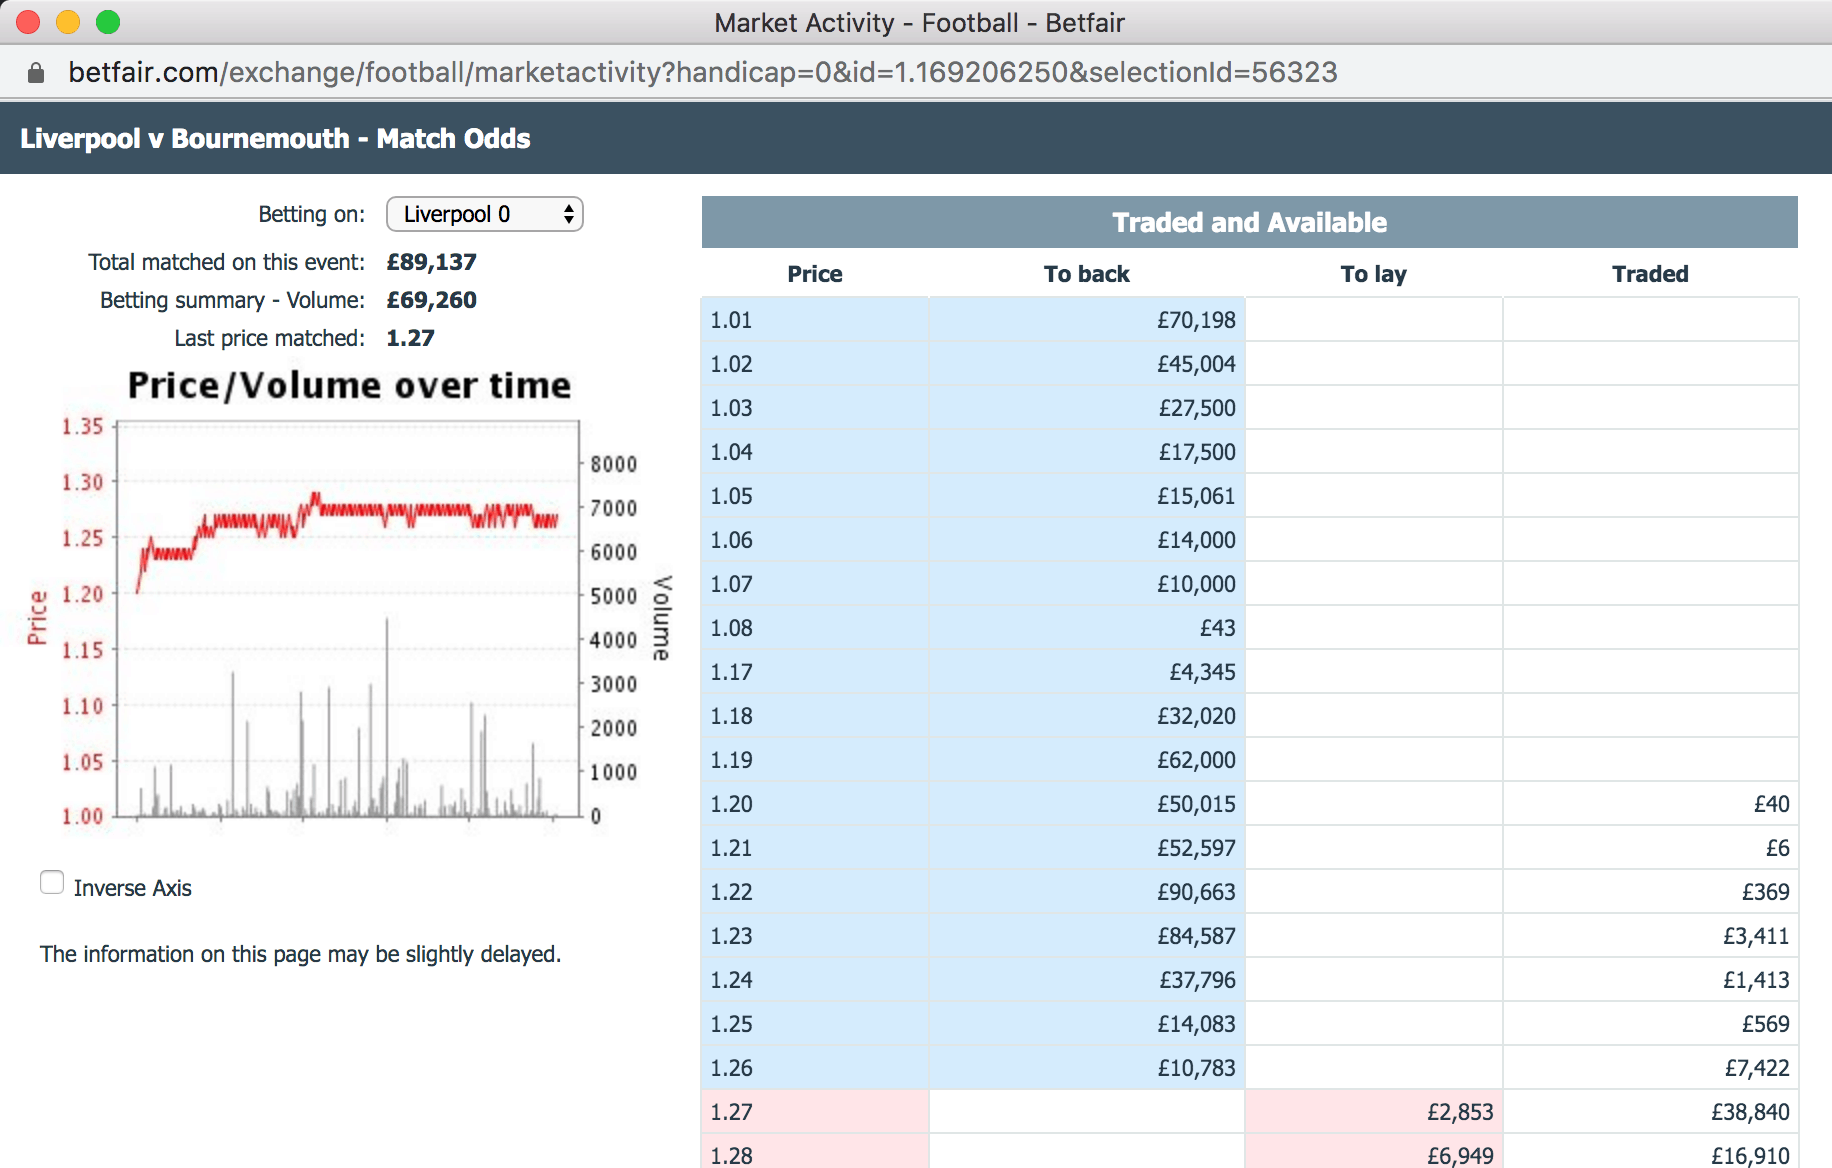
The same can been seen on the draw market for the same game. It is pretty static between 6.80 and 7.00
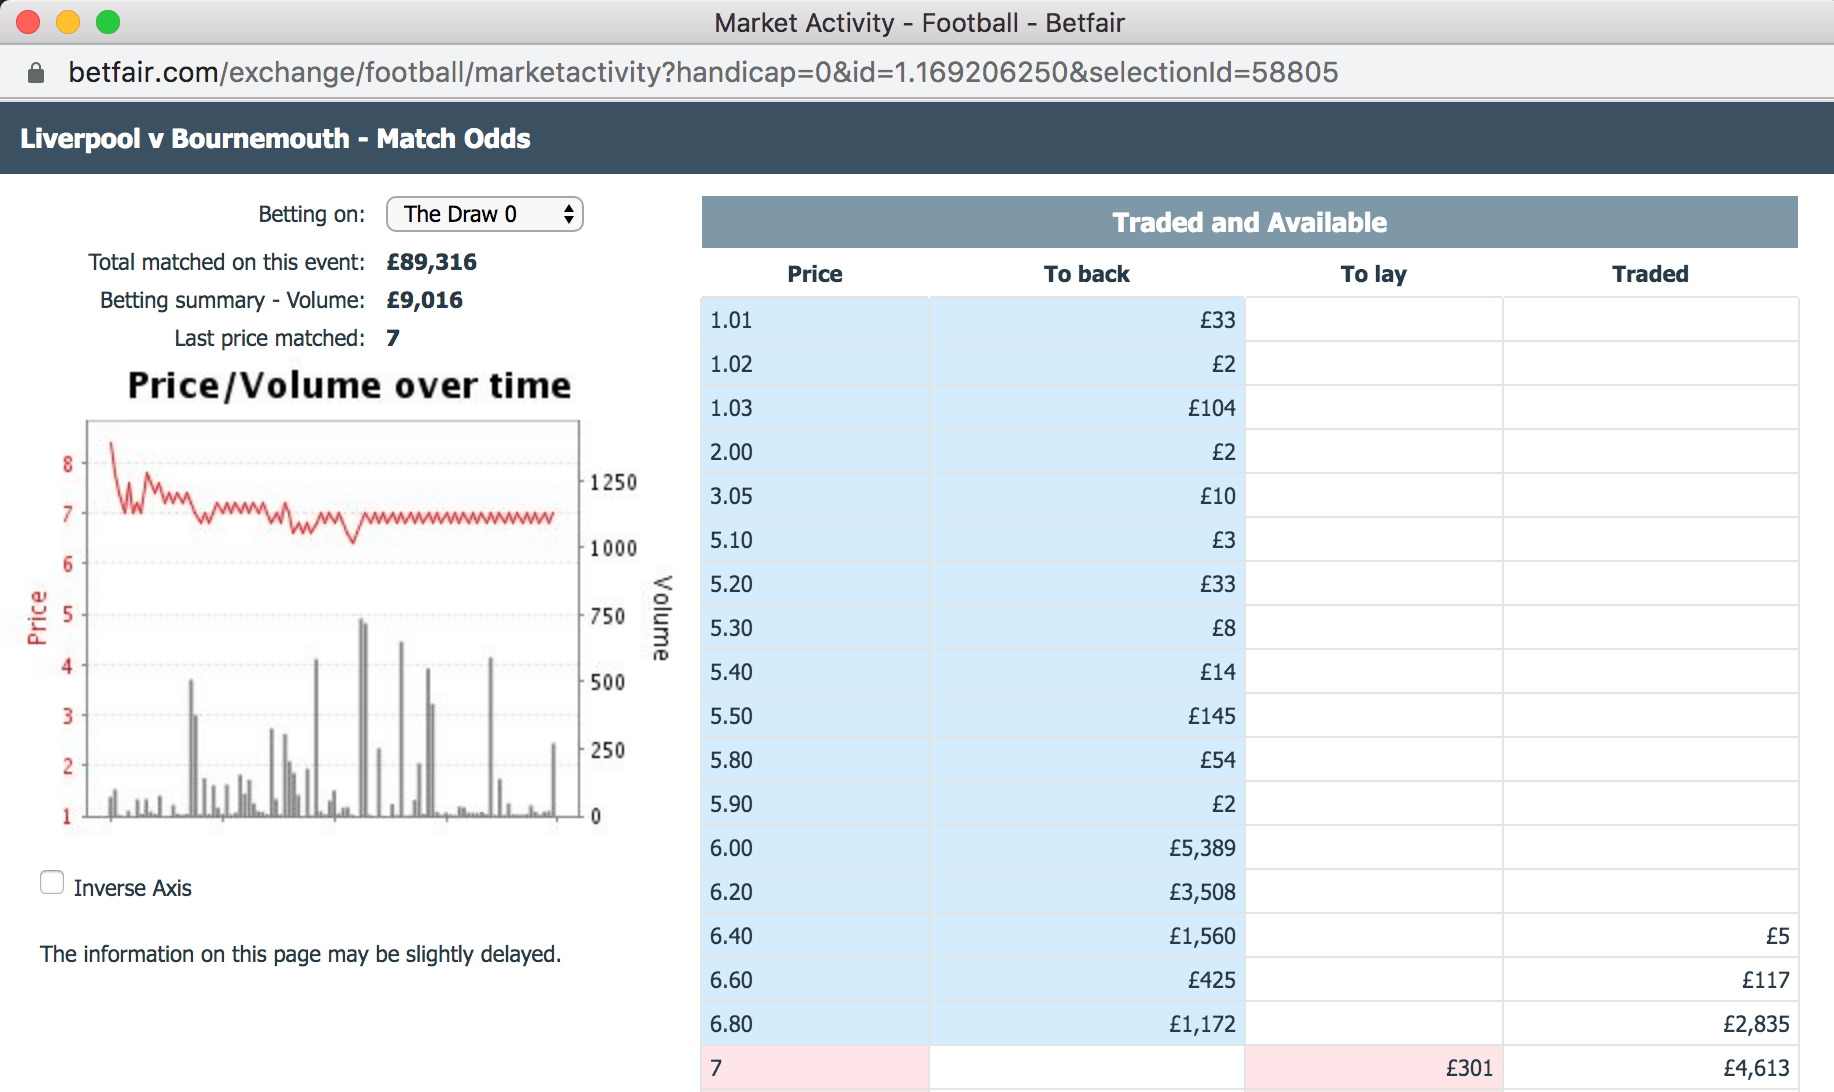
When a market is behaving like this, we can simply place a back bet 1 tick higher and, once matched, a lay price 1 tick lower. Effectively locking in 1 tick profit each time.
It can take time for you to get matched – these screenshots were taken from Friday morning – but theoretically, you could keep doing this over and over, making 1 tick profit each time.
There is more value to be had in the draw market (rather than Liverpool), as the tick gap is larger (6.80-7.00, rather than 1.26 to 1.27), so each tick will be worth more.
Then you can either hedge the bet for an equal profit on all outcomes. In this example, we would have made £2.94 per tick. If we did that 5, or 10 times over the 24 hours before the game, we could make up to £30.00 profit before a ball has been kicked.
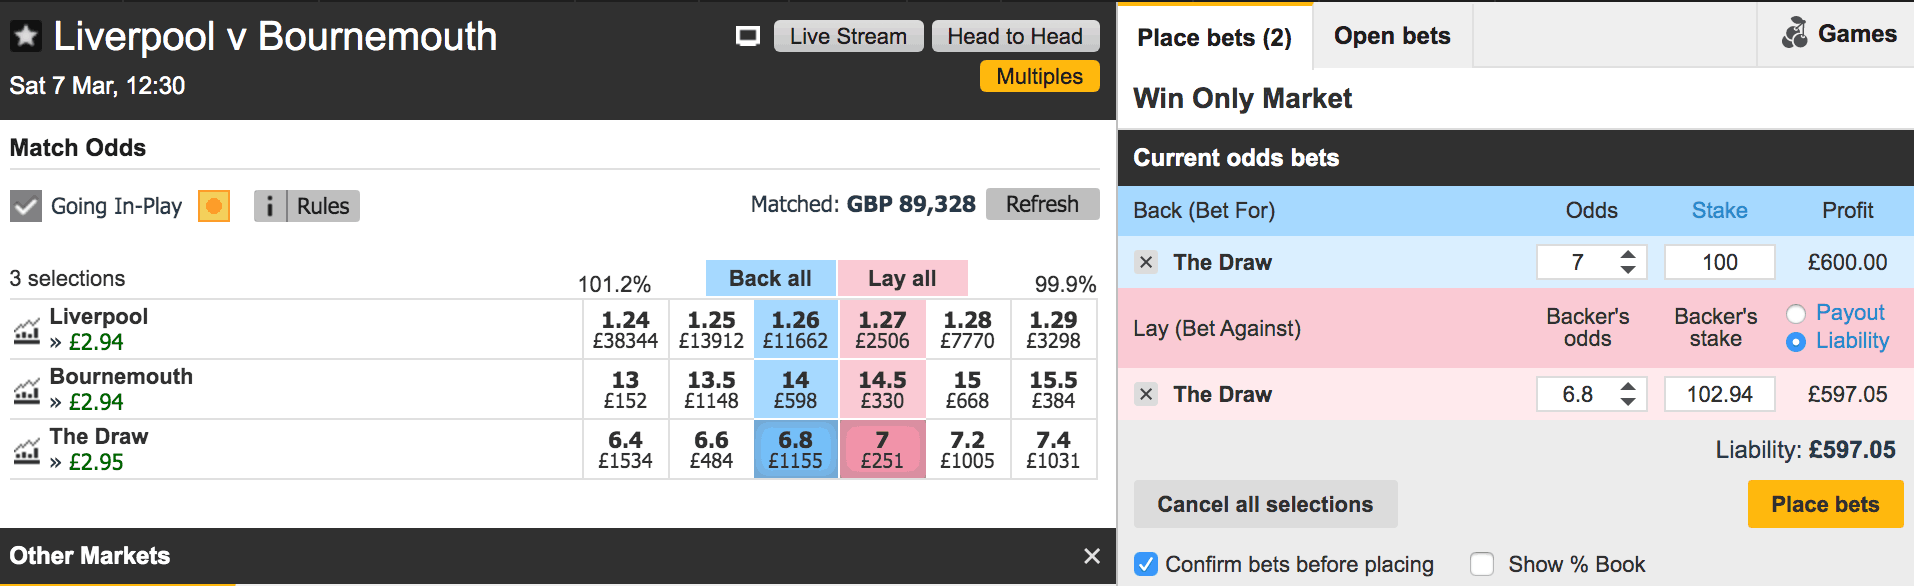
Alternatively, you can create a situation whereby you have a free bet on the draw. Less likely to collect, but when you do collect your profit and margins will be higher.
Hopefully by now you have a much stronger grasp of the Betfair Graphs, when they can be useful along with a couple of strategies on how you can use them to make real trading profits.
Let us know your thoughts on the article, as well as suggesting and future topics that you'd like us to cover in future, in the comments below.
![]()
Our premier football betting service, Football Profits, had supremely strong February to continue our profitable season to date.
With an ROI of 30.11%, a Profit on Turnover % (POT%) of 19.04% and an average strike rate of 67-70%, it is easy to see why this service is so popular with members.
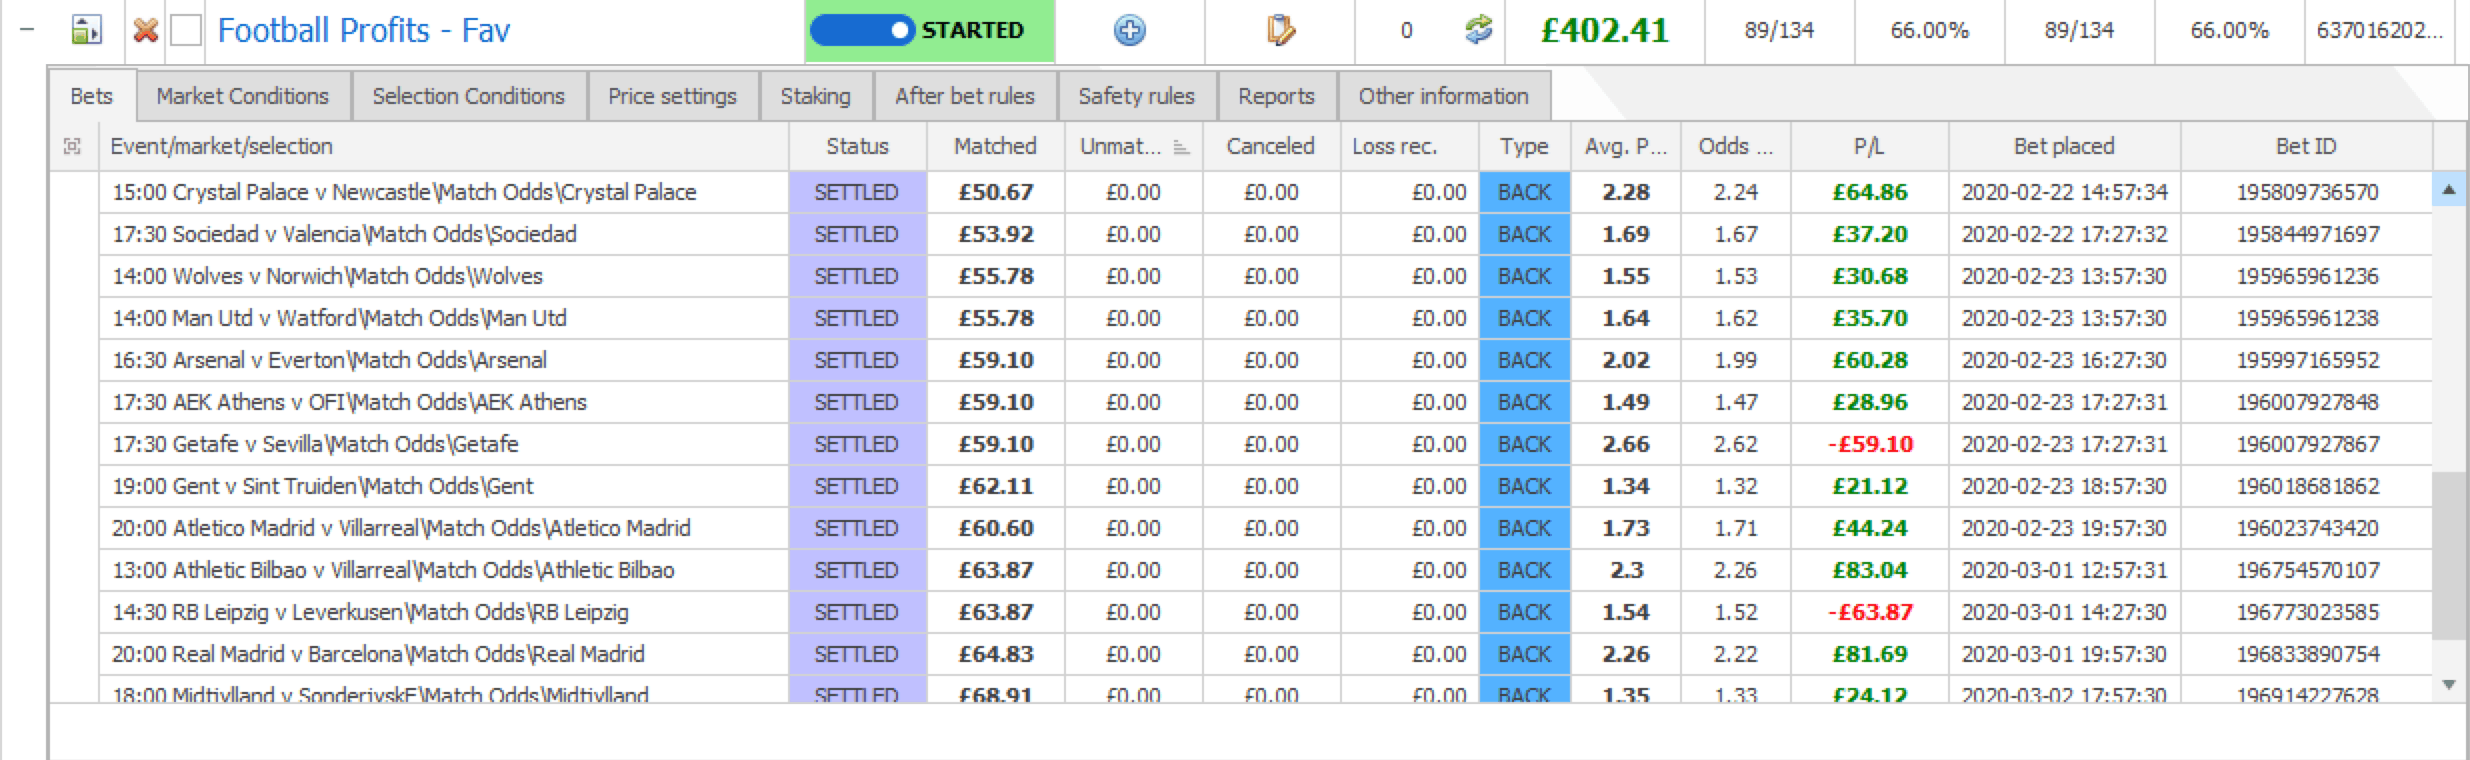
It can also be fully automated via our BF Bot Manager Integration – true hands-off profits!
If you'd like to trial Football Profits for yourself today, you can get up to six months free with this link
>>> Join Football Profits Today And Get Up To 6 Months Free
| Competition | Description | Selection | Matched amount | Avg. price matched | P/L | Placed date | Strategy | 1000 |
| Spanish La Liga | 15:00 Getafe v Valencia\Match Odds\Getafe | Getafe | 55.07 | 2.1 | 60.58 | 8/2/20 14:57 | Football Profits – Fav | 1060.58 |
| Greek Super League | 16:00 PAOK v OFI\Match Odds\PAOK | PAOK | 58.1 | 1.17 | 9.88 | 9/2/20 15:57 | Football Profits – Fav | 1070.46 |
| German Bundesliga | 17:00 Bayern Munich v RB Leipzig\Match Odds\Bayern Munich | Bayern Munich | 58.1 | 1.48 | -58.1 | 9/2/20 16:57 | Football Profits – Fav | 1012.36 |
| English Premier League | 20:00 Wolves v Leicester\Match Odds\Wolves | Wolves | 55.68 | 2.74 | -55.68 | 14/2/20 19:57 | Football Profits – Fav | 956.68 |
| Spanish La Liga | 15:00 Barcelona v Getafe\Match Odds\Barcelona | Barcelona | 52.9 | 1.42 | 22.22 | 15/2/20 14:57 | Football Profits – Fav | 978.9 |
| Belgian First Division A | 17:00 Club Brugge v Waasland-Beveren\Match Odds\Club Brugge | Club Brugge | 52.9 | 1.16 | 8.47 | 15/2/20 16:57 | Football Profits – Fav | 987.37 |
| Spanish La Liga | 17:30 Villarreal v Levante\Match Odds\Villarreal | Villarreal | 54.01 | 1.58 | 31.33 | 15/2/20 17:27 | Football Profits – Fav | 1018.7 |
| Italian Serie A | 14:00 Juventus v Brescia\Match Odds\Juventus | Juventus | 56 | 1.18 | 10.08 | 16/2/20 13:57 | Football Profits – Fav | 1028.78 |
| Greek Super League | 15:15 Xanthi v Lamia\Match Odds\Xanthi | Xanthi | 56 | 2.12 | -56 | 16/2/20 15:12 | Football Profits – Fav | 972.78 |
| Spanish La Liga | 20:00 Real Madrid v Celta Vigo\Match Odds\Real Madrid | Real Madrid | 53.7 | 1.27 | -53.7 | 16/2/20 19:57 | Football Profits – Fav | 919.08 |
| English Premier League | 20:00 Chelsea v Man Utd\Match Odds\Chelsea | Chelsea | 51.02 | 2.04 | -51.02 | 17/2/20 19:57 | Football Profits – Fav | 868.06 |
| English Premier League | 12:30 Chelsea v Tottenham\Match Odds\Chelsea | Chelsea | 48.47 | 1.91 | 44.11 | 22/2/20 12:27 | Football Profits – Fav | 912.17 |
| German Bundesliga | 14:30 Mgladbach v Hoffenheim\Match Odds\Mgladbach | Mgladbach | 50.67 | 1.62 | -50.67 | 22/2/20 14:27 | Football Profits – Fav | 861.5 |
| English Premier League | 15:00 Southampton v Aston Villa\Match Odds\Southampton | Southampton | 50.67 | 1.81 | 41.04 | 22/2/20 14:57 | Football Profits – Fav | 902.54 |
| Spanish La Liga | 15:00 Barcelona v Eibar\Match Odds\Barcelona | Barcelona | 50.67 | 1.19 | 9.63 | 22/2/20 14:57 | Football Profits – Fav | 912.17 |
| English Premier League | 15:00 Crystal Palace v Newcastle\Match Odds\Crystal Palace | Crystal Palace | 50.67 | 2.28 | 64.86 | 22/2/20 14:57 | Football Profits – Fav | 977.03 |
| Spanish La Liga | 17:30 Sociedad v Valencia\Match Odds\Sociedad | Sociedad | 53.92 | 1.69 | 37.2 | 22/2/20 17:27 | Football Profits – Fav | 1014.23 |
| English Premier League | 14:00 Man Utd v Watford\Match Odds\Man Utd | Man Utd | 55.78 | 1.64 | 35.7 | 23/2/20 13:57 | Football Profits – Fav | 1049.93 |
| English Premier League | 14:00 Wolves v Norwich\Match Odds\Wolves | Wolves | 55.78 | 1.55 | 30.68 | 23/2/20 13:57 | Football Profits – Fav | 1080.61 |
| English Premier League | 16:30 Arsenal v Everton\Match Odds\Arsenal | Arsenal | 59.1 | 2.02 | 60.28 | 23/2/20 16:27 | Football Profits – Fav | 1140.89 |
| Greek Super League | 17:30 AEK Athens v OFI\Match Odds\AEK Athens | AEK Athens | 59.1 | 1.49 | 28.96 | 23/2/20 17:27 | Football Profits – Fav | 1169.85 |
| Spanish La Liga | 17:30 Getafe v Sevilla\Match Odds\Getafe | Getafe | 59.1 | 2.66 | -59.1 | 23/2/20 17:27 | Football Profits – Fav | 1110.75 |
| Belgian First Division A | 19:00 Gent v Sint Truiden\Match Odds\Gent | Gent | 62.11 | 1.34 | 21.12 | 23/2/20 18:57 | Football Profits – Fav | 1131.87 |
| Spanish La Liga | 20:00 Atletico Madrid v Villarreal\Match Odds\Atletico Madrid | Atletico Madrid | 60.6 | 1.73 | 44.24 | 23/2/20 19:57 | Football Profits – Fav | 1176.11 |
| Spanish La Liga | 13:00 Athletic Bilbao v Villarreal\Match Odds\Athletic Bilbao | Athletic Bilbao | 63.87 | 2.3 | 83.04 | 1/3/20 12:57 | Football Profits – Fav | 1259.15 |
| German Bundesliga | 14:30 RB Leipzig v Leverkusen\Match Odds\RB Leipzig | RB Leipzig | 63.87 | 1.54 | -63.87 | 1/3/20 14:27 | Football Profits – Fav | 1195.28 |
| Spanish La Liga | 20:00 Real Madrid v Barcelona\Match Odds\Real Madrid | Real Madrid | 64.83 | 2.26 | 81.69 | 1/3/20 19:57 | Football Profits – Fav | 1276.97 |
| Danish Superliga | 18:00 Midtjylland v SonderjyskE\Match Odds\Midtjylland | Midtjylland | 68.91 | 1.35 | 24.12 | 2/3/20 17:57 | Football Profits – Fav | 1301.09 |
| Profit | 301.09 | |||||||
| ROI | 30.11% | |||||||
| POT | 19.04% | |||||||
| Staked | 1581.6 |
>>> Join Football Profits Today And Get Up To 6 Months Free

Jon is the Founder and Chief Tipster at Football Advisor and Predictoloy. He started life as data analyst in the digital marketing field before find his true calling in the world of Football and Horse Racing Betting.
Jon has been sharing his professional expertise since 2009 and specialises in using objective data analysis and subjective experience of betting built up over more than a decade of professional betting.
In 2014, Jon also launched (and continues to run) the trusted Football Advisor service service which provides a variety of football and horse racing betting models and portfolios. A few years later, Jon launched the Predictology platform which is the worlds first betting system builder and analyser covering a wealth of football betting related statistics covering more than 200,000 matches.
Jon has also lent his knowledge and expertise to several of the trusted Premium Services offered by the respected Secret Betting Club, including Football Lay Profits. Racing Bet Profits and, most recently, Racing Lay Profits.